Clustering
Outline
Clustering ? What is it ?
- Cluster is a group of tables that share the same data blocks because they share the same columns and are frequently used together
- Clusters are transparent to query languages
- Clusters are logically and physically dependent of the data in the associated tables
- Once created, a cluster is automatically maintained and used by a database system
- Performance related observations
- Retrieval performance of clustered tables may be better than retrieval performance of non-clustered tables
- Presence of clusters decreases performance of UPDATE, DELETE, and INSERT operations
Clustering
Outline
Sample clustered data structures
- Consider the relational tables EMP and DEPT with information about the employees and departments the employees are located at
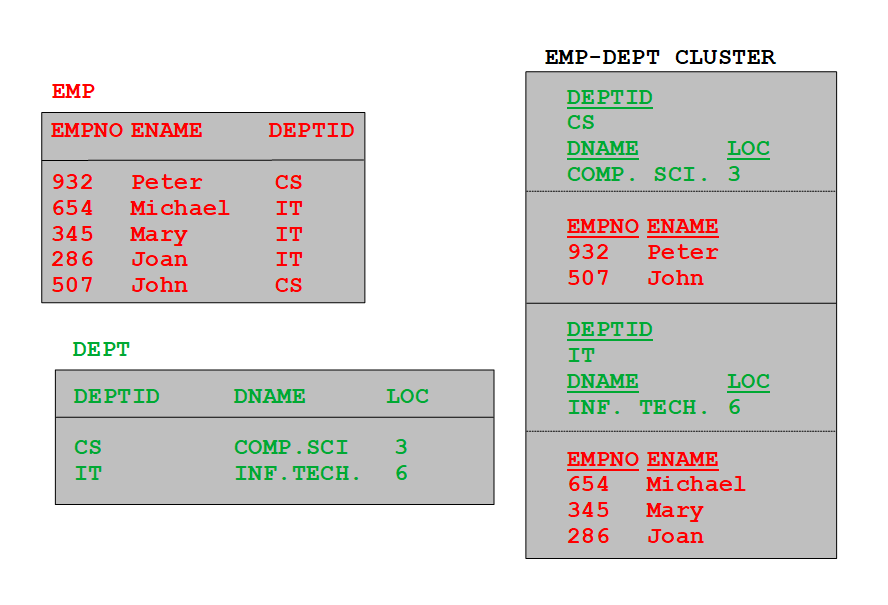
- EMP-DEPT cluster contains the rows from a relational table DEPT grouped by DEPTID and joined with the rows from a relational table EMP
Clustering
Outline
Creating a cluster
- A cluster can be created in the following way
CREATE CLUSTER COUNTRY_CLST
 (CO_ID NUMBER(4) )
 INDEX
 PCTFREE 0;
CREATE INDEX COUNTRY_IDX ON CLUSTER COUNTRY_CLST;
Clustering
Outline
Loading the relational tables into a cluster
- A relational table COUNTRY can be created in a cluster COUNTRY_CLST in the following way
CREATE TABLE COUNTRY(
 CO_ID              NUMERIC(4)         NOT NULL,
 CO_NAME            VARCHAR(50)        NOT NULL,
 …         …        …        …       …       …
   CONSTRAINT COUNTRY_PKEY PRIMARY KEY (CO_ID),
   CONSTRAINT COUNTRY_CHECK1 CHECK(CO_ID > 0) )
CLUSTER COUNTRY_CLST(CO_ID);
CREATE TABLE ADDRESS(
 ADDR_ID           NUMERIC(10)  NOT NULL,
 ADDR_CO_ID        NUMERIC(4)   NOT NULL,
 …        …         …       …       …      …
  CONSTRAINT ADDRESS_PKEY PRIMARY KEY (ADDR_ID),
  CONSTRAINT ADDRESS_FKEY FOREIGN KEY (ADDR_CO_ID)
                REFERENCES COUNTRY(CO_ID),
        CONSTRAINT ADDRESS_CHECK1 CHECK(ADDR_ID > 0) )
CLUSTER COUNTRY_CLST(ADDR_CO_ID);
Clustering
Outline
Clustering costs versus benefits
- Consider the relational tables
PART(pnum, pname, price)
SP(pnum, snum, qty)
SUPPLIER(snum, sname, address)
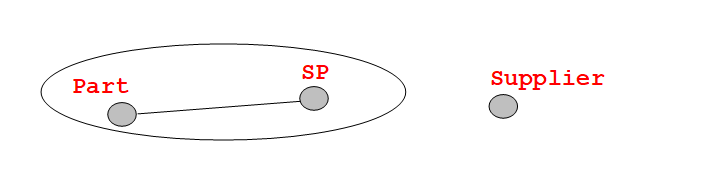
frequency(PART JOIN SP)
Clustering costs versus benefits
- Consider the relational tables
PART(pnum, pname, price)
SP(pnum, snum, qty)
SUPPLIER(snum, sname, address)
- Variant 2: Clustering of SUPPLIER and SP over snum
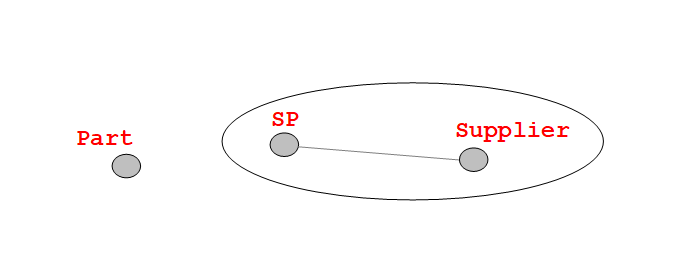
- Benefits: no need to process join of relational tables SUPPLIER and SP
- Costs: instead of join operation a cluster over pnum must be read
- ( cost(SUPPLIER JOIN SP) - cost(cluster(SUPPLIER UNION SP)) )*
frequency(SUPPLIER JOIN SP)
Clustering costs versus benefits
- Consider the relational tables
PART(pnum, pname, price)
SP(pnum, snum, qty)
SUPPLIER(snum, sname, address)
- size(SP(pnum, snum, qty)) = 50 blocks
- size(SUPPLIER(snum, sname, address) = 100 blocks
- cost(PART JOIN SP) = 7000 read blocks, frequency = 10 times per day
- cost(SUPPLIER JOIN SP) = 2500 read blocks, frequency = 30 times per day
- Variant 1
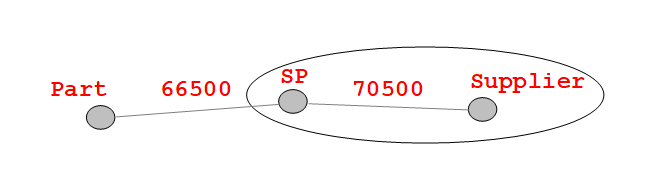
- Savings = (7000 - (300+50) ) * 10 = 66500 read blocks
- Variant 2
- Savings = (2500 - (100+50) ) * 30 = 70500 read blocks
Clustering costs versus benefits
- Variant 1
- Savings = (7000 - (300+50) ) * 10 = 66500 read blocks
- Variant 2
- Savings = (2500 - (100+50) ) * 30 = 70500 read blocks
Clustering
Outline
Optimal clustering
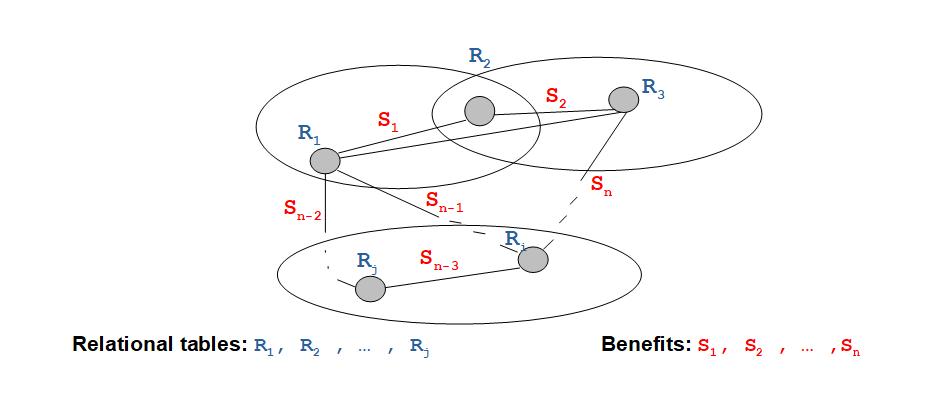
- Problem
- Given a binary graph (clustering graph) representing all possible clustering variants together with evaluation of benefits for each one of them
- Find the smallest set of variants V that maximizes the savings
Clustering
Outline
Suboptimal clustering
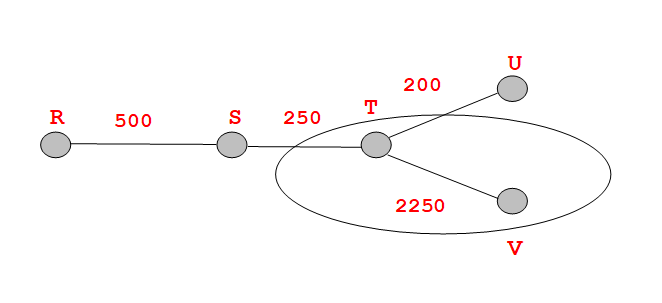
- Algorithm
Make a set of clustering variants V empty
repeat
Find in a clustering graph a variant Vmax that maximises savings;
Add Vmax to V;
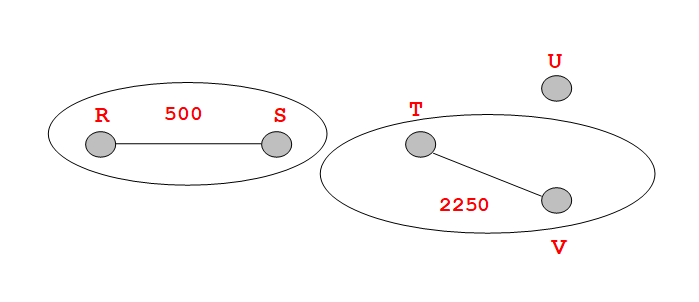
  Remove from a clustering graph an edge that represents a variant Vmax
	   and all edges that represent variants inconsistent with Vmax;
until clustering graph has no edges;
Suboptimal clustering
- Assume that database consists of the following relational tables:
- R size 100 blocks
- S size 50 blocks
- T size 200 blocks
- U size 80 blocks
- V size 50 blocks
- Assume that the tables
- R and S are joined on average 10 times per day
- S and T are joined on average 5 times per day
- T and U are joined on average 10 times per day
- T and V are joined on average 24 times per day
Suboptimal clustering
- Assume that join of
- R and S needs 200 read block operations
- S and T needs 300 read block operations
- T and U needs 300 read block operations
- T and V needs 400 read block operations
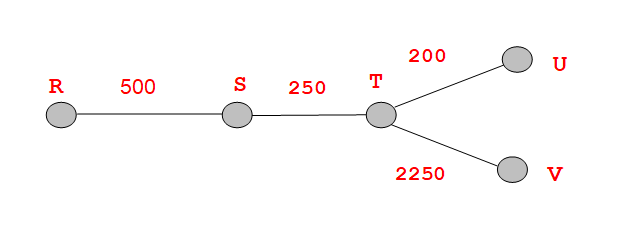
- Then, the benefits form clustering of
- R and S are equal to 10 * 200 - 10 * (100 + 50) = 500 reads per day
- S and T are equal to 5 * 300 - 5 * (50 + 200) = 250 reads per day
- T and U are equal to 10 * 300 - 10 * (200 + 80) = 200 reads per day
- T and V are equal to 15 * 400 - 15 * (200 + 50) = 2250 reads per day
Suboptimal clustering
- Then, the benefits form clustering of
- R and S are equal to 10 * 200 - 10 * (100 + 50) = 500 reads per day
- S and T are equal to 5 * 300 - 5 * (50 + 200) = 250 reads per day
- T and U are equal to 10 * 300 - 10 * (200 + 80) = 200 reads per day
- T and V are equal to 15 * 400 - 15 * (80 + 50) = 2250 reads per day
- Clustering graph
Suboptimal clustering
- Cluster T and V
- Cluster R and S
References
- Cookbook, How to cluster relational tables ?
- Ramakrishnan R., J. Gehrke Database Management Systems, chapter 20.4.1