Data Warehouse Concepts
Outline
OLAP versus OLTP
- Traditional database systems designed and tuned to support the day-to-day operation:
- Ensure fast, concurrent access to data
- Transaction processing and concurrency control
- Focus on online update data consistency
- Known as operational databases or online transaction processing (OLTP)
- OLTP database characteristics:
- Detailed data
- Do not include historical data
- Highly normalized
- Poor performance on complex queries including joins an aggregation
- Data analysis requires a new paradigm: online analytical processing (OLAP)
- Typical OLTP query: pending orders for a customer
- Typical OLAP query: total sales amount by a product and by a customer
OLAP versus OLTP
- OLAP characteristics
- OLTP paradigm focused on transactions, OLAP focused on analytical queries
- Normalization not good for analytical queries, reconstructing data requires a high number of joins
- OLAP databases support a heavy query load
- OLTP indexing techniques not efficient in OLAP: oriented to access few records; OLAP queries typically include aggregation
- The need for a different database model to support OLAP was clear: led to data warehouses
- Data warehouse: (usually) large repositories that consolidate data from different sources (internal and external to the organization), are updated offline, follow the multidimensional data model, designed and optimized to efficiently support OLAP queries
Data Warehouse Concepts
Outline
The Multidimensional Model
- A view of data in n-dimensional space: a data cube
- A data cube is composed of dimensions and facts
- Dimensions: Perspectives used to analyze the data
- Example: A three-dimensional cube for sales data with dimensions Product, Time, and Customer, and a measure Quantity
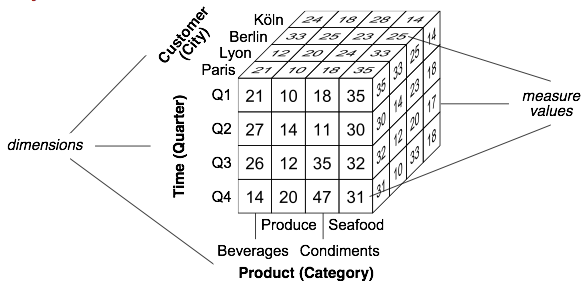
- Attributes describe dimensions
- Product dimension may have attributes ProductNumber and UnitPrice (not shown in the figure)
The Multidimensional Model
- The cells or facts of a data cube have associated numeric values called measures
- Each cell of the data cube represents Quantity of units sold by category, quarter, and customer's city
- Data granularity: level of detail at which measures are represented for each dimension of the cube
- Example: sales figures aggregated to granularities Category, Quarter, and City
The Multidimensional Model
- Instances of a dimension are called members
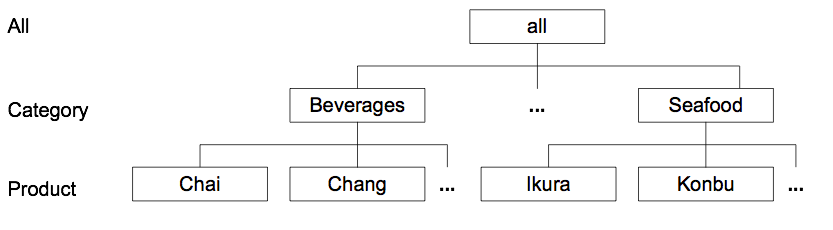
- Example: Seafood and Beverages are members of the Product at the granularity Category
- A data cube contains several measures, e.g. Amount, indicating the total sales amount (not shown)
- A data cube may be sparse (typical case) or dense
- Example: not all customers may have ordered products of all categories during all quarters
- Hierarchies: allow viewing data at several granularities
- Define a sequence of mappings relating lower-level, detailed concepts to higher-level ones
- The lower level is called the child and the higher level is called the parent
- The hierarchical structure of a dimension is called the dimension schema
- A dimension instance comprises all members at all levels in a dimension
The Multidimensional Model
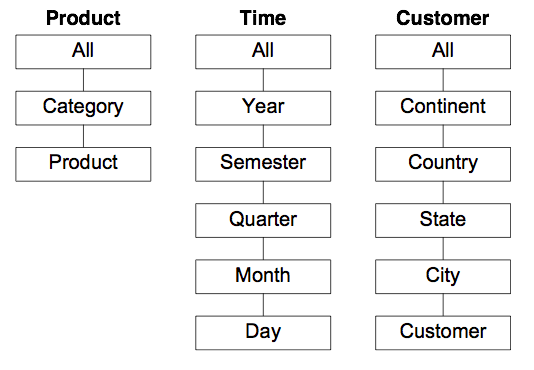
- In the previous figure, granularity of each dimension indicated between parentheses: Category for the Product dimension, Quarter for Time, and City for Customer
- We may want sales figures at a finer granularity (Month), or at a coarser granularity (Country)
- Hierarchies of the Product, Time, and Customer dimensions
The Multidimensional Model
- Members of a hierarchy Product - Category
The Multidimensional Model: Measures
- Aggregation of measures changes the abstraction level at which data in a cube are visualized
- Measures can be:
- Additive: can be meaningfully summarized along all the dimensions, using addition; The most common type of measures
- Semiadditive: can be meaningfully summarized using addition along some dimensions; Example: inventory quantities, which cannot be added along the Time dimension
- Nonadditive measures cannot be meaningfully summarized using addition across any dimension; Example: item price, cost per unit, and exchange rate
The Multidimensional Model: Measures
- Another classification of measures:
- Distributive: defined by an aggregation function that can be computed in a distributed way; Functions count, sum, minimum, and maximum are distributive, distinct count is not; Example: S = {3, 3, 4, 5, 8, 4, 7, 3, 8} partitioned in subsets {3, 3, 4}, {5, 8, 4}, {7, 3, 8} gives a result of 8, while the answer over the original set is 5
- Algebraic measures are defined by an aggregation function that can be expressed as a scalar function of distributive ones; example: average, computed by dividing the sum by the count
Data Warehouse Concepts
Outline
OLAP Operations
OLAP Operations
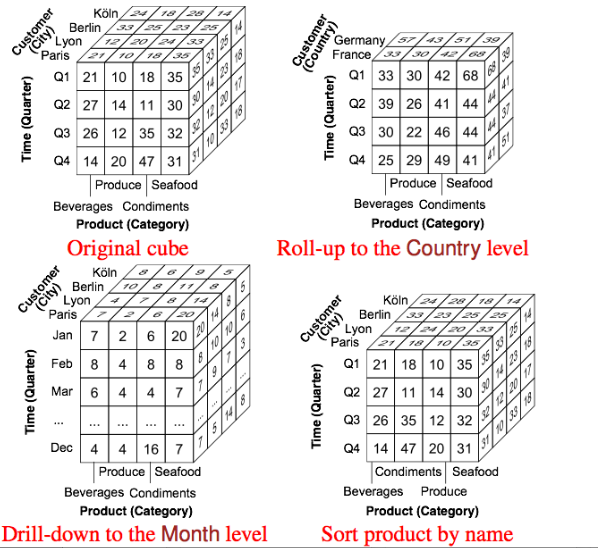
- Starting cube: quarterly sales (in thousands) by product category and customer cities for 2012
- We first compute the sales quantities by country: a roll-up operation to the Country level along the Customer dimension
- Sales of category Seafood in France significantly higher in the first quarter
- To find out if this occurred during a particular month, we take cube back to City aggregation level, and drill-down along Time to the Month level
- To explore alternative visualizations, we sort products by name
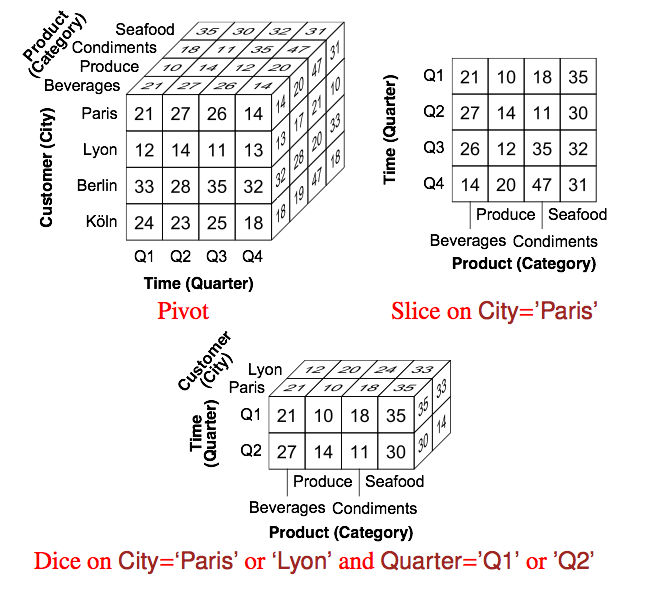
- To see the cube with the Time dimension on the x axis, we rotate the axes of the original cube, without changing granularities → pivoting (see next 2 slides)
OLAP Operations
- To visualize the data only for Paris → slice operation, results in a 2-dimensional sub-cube, basically a collection of time series (see next slide)
- To obtain a 3-dimensional sub-cube containing only sales for the first two quarters and for the cities Lyon and Paris, we go back to the original cube and apply a dice operation
OLAP Operations
OLAP Operations
- The operations in the previous slides can be defined using the following algebraic operators.
- Roll-up: aggregates measures along a dimension hierarchy (using an aggregate function) to obtain
measures at a coarser granularity
ROLLUP(CubeName, (Dimension → Level)*, AggFunction(Measure)*)
ROLLUP(Sales, Customer → Country, SUM(Quantity))
ROLLUP*(CubeName, [(Dimension → Level)*], AggFunction(Measure)*)
ROLLUP*(Sales, Time → Quarter, SUM(Quantity))
ROLLUP*(Sales, Time → Quarter, COUNT(Product) AS ProdCount)
RECROLLUP(CubeName, Dimension → Level, AggFunction(Measure)*)
OLAP Operations
- Drill-down moves from a more general level to a more detailed level in a hierarchy
DRILLDOWN(CubeName, (Dimension → Level)*)
DRILLDOWN(Sales, Time → Month)
SORT(CubeName, Dimension, Expression [ASC | DESC])
SORT(Sales, Product, NAME)
OLAP Operations
- Pivot
PIVOT(CubeName, (Dimension → Axis)*)
- where the axes are specified as {X, Y, Z, X1, Y1, Z1, ... }.
PIVOT(Sales, Time → X, Customer → Y, Product → Z)
SLICE(CubeName, Dimension, Level = Value)
SLICE(Sales, Customer, City = 'Paris')
OLAP Operations
- Dice:
DICE(CubeName, ? )
- where ? is a Boolean condition over dimension levels, attributes, and measures.
DICE(Sales, (Customer.City = 'Paris' OR Customer.City = 'Lyon') AND
            (Time.Quarter = 'Q1' OR Time.Quarter = 'Q2') )
Data Warehouse Concepts
Outline
Typical Data Warehouse Architecture
Data Warehouse Architecture
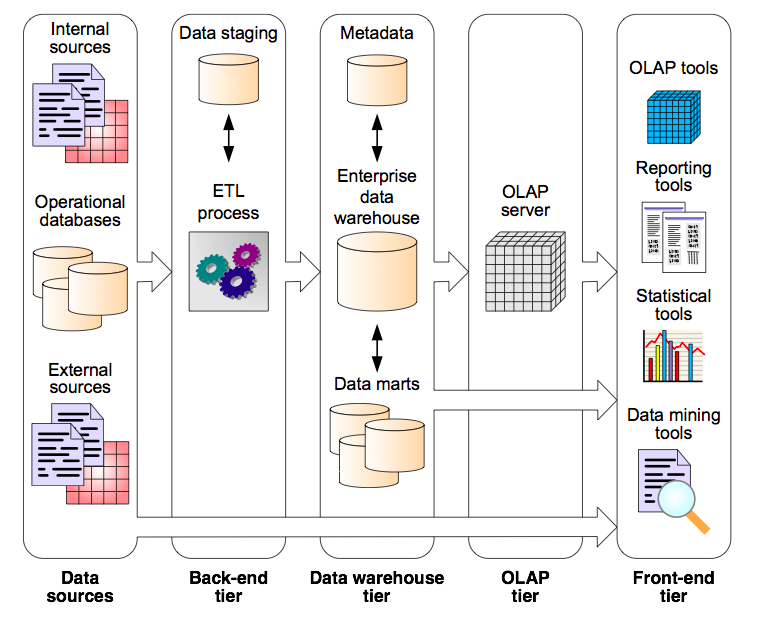
- General data warehouse architecture: several tiers
- Back-end tier composed of:
- The extraction, transformation, and loading (ETL) tools: Feed data into the data warehouse from operational databases and internal and external data sources
- The data staging area: An intermediate database where all the data integration and transformation processes are run prior to the loading of the data into the data warehouse
- Data warehouse tier composed of:
- An enterprise data warehouse and/or several data marts
- A metadata repository storing information about the data warehouse and its contents
- OLAP tier composed of:
- An OLAP server which provides a multidimensional view of the data, regardless the actual way in which data are stored
Data Warehouse Architecture
- Front-end tier is used for data analysis and visualization
- Contains client tools such as OLAP tools, reporting tools, statistical tools, and data-mining tools
References
- A. VAISMAN, E. ZIMANYI, Data Warehouse Systems: Design and Implementation, Chapter 3 Data Warehouse Concepts, Springer Verlag, 2014